Performance Data
Highlights
-
- Top 9% of schools in the country for attendance
- Top 10% of schools in the country for low persistent absence
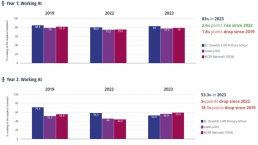
- Above national average for Good Level of Development in EYFS
- Above national average for Phonics in Year 1
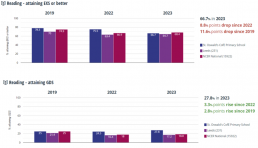
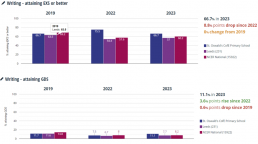
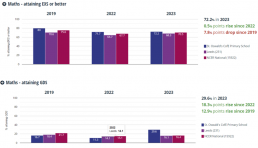
- Reading, Writing & Maths attainment at end of KS1 significantly above national average
- Exceptional end of KS2 progress for children in Reading, Writing & Maths – top 20% of schools nationally
- Significantly above national average Reading, Writing & Maths attainment at end of KS2
- Disadvantaged pupils at the end of Key Stage 2 made better than average progress than national averages for disadvantaged pupils in Reading
- Disadvantaged pupils at the end of Key Stage 2 made better than average progress than national averages for both disadvantaged and non-disadvantaged pupils in Writing – the top 33% of schools nationally
- Disadvantaged pupils at the end of Key Stage 2 made better than average progress than national averages for both disadvantaged and non-disadvantaged pupils in Maths – the top 28% of schools nationally
Areas to watch
-
- At the end of KS1, only 2 out of 10 disadvantaged pupils achieved expected standard in Reading, Writing and Maths – these children will need significant support through Key Stage 2
Attendance
Overall attendance
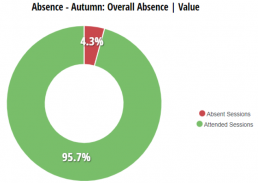
- Our school is in percentile 9 when compared to all schools nationally for Overall Absence.
- The school in the same decile as we had an Overall Absence percentage between 1.5% and 4.4%.
- Our school rose 30 places in the percentile rankings between 2021/22 and 2022/23, from 39 to 9.
Persistent Absence
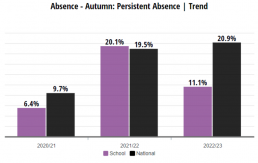
- Our school’s persistent absence has decreased by 9.0% from 20.1% in 2021/22 to 11.1% in 2022/23.
- This is equivalent to 31 fewer pupils being persistent absentees in 2022/23 compared to 2021/22.
- Your school’s average for the last 3 academic year(s) is 12.6%.
Academic Attainment
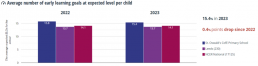
Early Years
Key Stage 1 - Phonics
Key Stage 1 - Reading
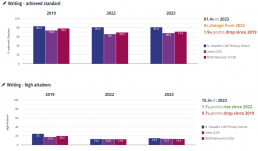
Key Stage 1 - Writing
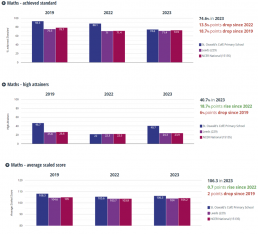
Key Stage 1 - Maths
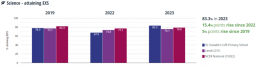
Key Stage 1 - Science
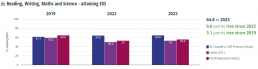
Key Stage 1 - Reading, Writing & Maths
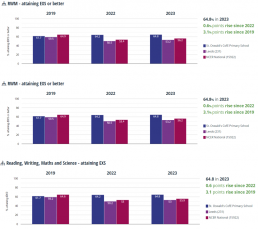
Key Stage 1 - Reading, Writing, Maths & Science
Key Stage 2
Reading Progress (Gap to National)
| School | National | Difference | ||
| +2.38 | – | +0.03 | = | +2.35 |
The school is significantly better than the national average.
Writing Progress (Gap to National)
| School | National | Difference | ||
| +2.04 | – | +0.04 | = | +2.00 |
The school is significantly better than the national average.
Maths Progress (Gap to National)
| School | National | Difference | ||
| +3.03 | – | +0.04 | = | +2.99 |
The school is significantly better than the national average.
These are the most important measures of children’s learning and show the ‘value added’ during pupils’ time at St. Oswald’s. These are the best progress measures the school has ever had, and show that the St. Oswald’s children have made such good progress that indicates we are in the top 20% of schools in the UK for academic progress.
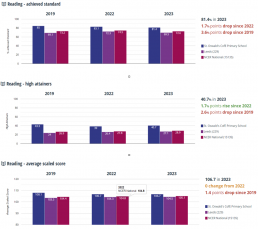
Key Stage 2 - Reading
Key Stage 2 - Writing
Key Stage 2 - Maths
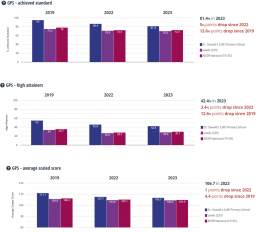
Key Stage 2 - GPS
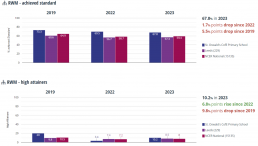
Key Stage 2 - Reading, Writing & Maths
Disadvantaged Pupils
EYFS
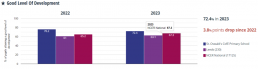
Good Level of Development
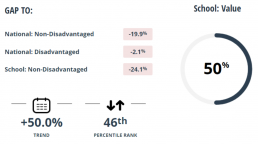
- 50.0% of your school’s Disadvantaged cohort achieved a good level of development, 2 pupils out of 4.
- This is 19.9% lower than the national Non- Disadvantaged cohort at 69.9%.
- The Disadvantaged pupil(s) in your school are in percentile 46 for EYFS good level of development when compared to other schools.
- Due to changes to the EYFSP framework this year, trend data will not be available until 2023
Expected Standard (Year 1)
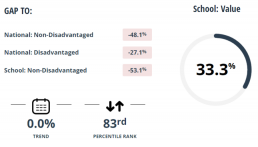
- 33.3% of your school’s Year 1 Disadvantaged cohort achieved the expected standard in Phonics, 1 pupils out of 3.
- This is 48.1% lower than the national Non- Disadvantaged cohort at 81.4%.
- Your school’s gap to Non-Disadvantaged pupils nationally has decreased by 2.3% from -45.8% in 2021/22, to -48.1% in 2022/23.
- Your Year 1 Disadvantaged cohort’s Phonics Expected Standard has remained the same from 33.3% in 2021/22, to 33.3% in 2022/23.
- The Disadvantaged Year 1 pupil(s) in your school are in percentile 83 for Phonics Expected Standard when compared to other schools.
Key stage 1
Reading Writing & Maths Expected Standard
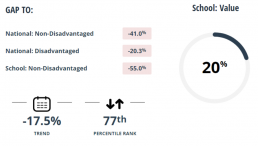
- 20.0% of your school’s Disadvantaged cohort achieved the expected standard in Reading, Writing & Maths, 2 pupils out of 10.
- This is 41.0% lower than the national Non-Disadvantaged cohort at 61.0%.
- Your school’s gap to Non-Disadvantaged pupils nationally has decreased by 20.4% from -20.6% in 2021/22, to -41.0% in 2022/23.
- Your Disadvantaged cohort’s Reading, Writing & Maths Expected Standard has decreased by 17.5% from 37.5% in 2021/22, to 20.0% in 2022/23.
- The Disadvantaged pupil(s) in your school are in percentile 77 for Reading, Writing & Maths Expected Standard when compared to other schools.
Key stage 2
Reading Progress
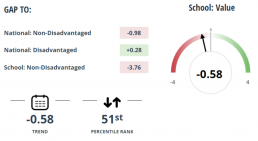
- Your school’s Disadvantaged cohort of 12 pupils have a Reading Progress Score of -0.58.
- This is 0.98 lower than the national Non- Disadvantaged cohort at +0.40.
- Your school’s gap to Non-Disadvantaged pupils nationally has decreased by 0.57 from –0.41 in 2021/22, to -0.98 in 2022/23.
- Your Disadvantaged cohort’s Reading Progress Score has decreased by 0.58 from 0.00 in 2021/22, to -0.58 in 2022/23.
- The Disadvantaged pupil(s) in your school are in percentile 51 for Reading Progress Score when compared to other schools.
Writing Progress
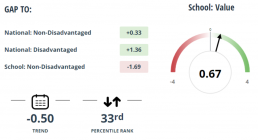
- Your school’s Disadvantaged cohort of 12 pupils have a Writing Progress Score of +0.67.
- This is 0.33 higher than the national Non-Disadvantaged cohort at +0.34.
- Your school’s gap to Non-Disadvantaged pupils nationally has decreased by 0.45 from ++0.78 in 2021/22, to +0.33 in 2022/23.
- Your Disadvantaged cohort’s Writing Progress Score has decreased by 0.50 from +1.17 in 2021/22, to +0.67 in 2022/23.
- The Disadvantaged pupil(s) in your school are in percentile 33 for Writing Progress Score when compared to other schools.
Maths Progress
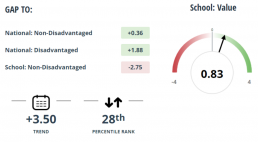
- Your school’s Disadvantaged cohort of 12 pupils have a Maths Progress Score of +0.83.
- This is 0.36 higher than the national Non-Disadvantaged cohort at +0.47.
- Your school’s gap to Non-Disadvantaged pupils nationally has improved by 3.57 from –3.21 in 2021/22, to +0.36 in 2022/23.
- Your Disadvantaged cohort’s Maths Progress Score has increased by 3.50 from -2.67 in 2021/22, to +0.83 in 2022/23.
- The Disadvantaged pupil(s) in your school are in percentile 28 for Maths Progress Score when compared to other schools.